 |
|
|
| Oxygen and Nutrient curves | Last Updated • September 25, 2010 | |
The amount of OXYGEN dissolved in ocean waters quickly decreases with depth
to reach a minimum at around 1000 m of depth.
Oxygen is abundant at the surface because of very high biological productivity:
phytoplanktonic organisms produce enormpus amounts of oxygen through photosynthesis.
But oxygen is also used up very quickly by animals that live in the water:
at depth (beyond the photic zone, around 100 m)
oxygen can not be produced (lack of sunlight) and whatever amount is present is rapidly consumed:
as a consequence, oxygen is quickly depleted below 100 m, reaching its minimum at around 1000 m.
Oxygen then slowly starts to increase past its minimum because:
- deep ocean currents, initiated by the sinking of oxygen-rich surface waters in polar areas
(Greenland and North Atlantic in general in the northern hemisphere,
and all around Antarctica in the southern hemisphere), slowly ventilate the ocean bottoms
- in the Bathypelagic and the Abyssopelagic zones there are less and less consumers,
so oxygen is not used up at the same rate it is in surface waters
|
NUTRIENTS (such as calcium, phosphate, potassium and other ions) are usually dissolved in water.
Factors as varied as chemical weathering and organic decay are responsible for their presence in ocean water.
As it is for oxygen, nutrients are also used up pretty quickly by living organisms, and represent a limiting factor for life:
you can have the right temperature, pressure, pH, transparency, et cetera, but if there is no food, there can be no life.
In shallow waters there is plenty of sunlight, and as a consequence
nutrients are depleted pretty quickly by the abundance of marine life. As soon as we move below the photic zone, where animal life decreases significantly,
nutrients start to increase again, reaching a maximum by the base of the Mesopelagic zone,
essentially in coincidence with the oxygen minimum.
Past that point, nutrients decrease very slowly because only few organisms live there.
At these depths, organisms are not very abundant because of the harsh conditions for life we encounter here:
they can survive, with no light at all and under enormous hydrostatic pressure,
only because of the presence of oxygen brought at depth by deep currents (which are, again, density-driven)
and of the slightly increased amounts of nutrients.
This diagram shows the variations of oxygen and nutrients (here represented by the phosphate ion) with depth in ocean waters.

© Alessandro Grippo, 2008
| |
| surface-water circulation | Last Updated • September 25, 2010 | |
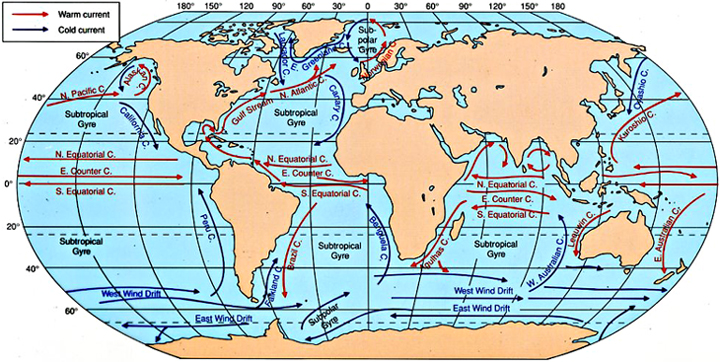
© Harold V.Thurman and Alan P. Trujillo, 1999. In: Essentials of Oceanography, 6th edition, Prentice-Hall, New Jersey, USA
Surface-water circulation is wind-driven: the wind drags the surface waters of Earth's oceans in gigantic gyres
centered in the northern and southern Atlantic and Pacific Oceans and in the southern Indian Ocean.
These gyres rotate clockwise in the northern hemisphere and counter-clockwise in the southern hemisphere (Coriolis effect).
| |
| deep-water circulation | Last Updated • September 25, 2010 | |
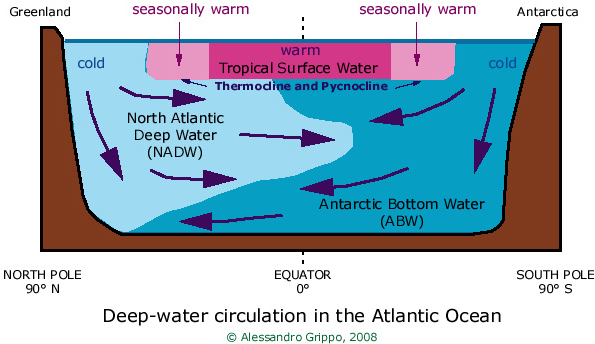
We have already seen that surface-water circulation is wind-driven.
Deep-water circulation instead is density-driven
This means that differences in water density cause motion of water masses at depth.
Density (mass over volume) changes with changing salinity and temperature of the ocean:
higher salinity implies higher density (and viceversa)
while higher temperatures imply lower density.
Tropical waters are warmer than polar waters because of more intense solar radiation around the equator:
as long as surface waters are warm, they can never sink to the bottom of the ocean.
Surface waters can only sink to the bottom when their density is the same or higher than that of deep waters.
This happens for instance in the North Atlantic ocean, where the formation of ice pack
causes a very cold water mass to slightly increase its salinity (and hence its density);
and all around Antarctica, where the extremely cold temperatures create similar conditions.
In the figure, pink indicates warm waters, while blue indicates cold waters.
In particular, light pink indicates waters that are only warm during the summer
(that is, June to August in the northern hemisphere, and December to February in the southern hemisphere),
while darker pink indicates waters that are always warm (tropical waters, between about 30°N and 30°S).
Light blue indicates the North Atlantic Deep Water, a very dense body of water that sinks to the bottom
but is still less dense then the Antarctic Bottom Water (in darker blue).
| |
| the pycnocline
| Last Updated • September 25, 2010 | |

DISTRIBUTION OF TEMPERATURE AND SALINITY
OF THE SURFACE OCEAN WATERS WITH LATITUDE
From this diagram we can see how temperatures variations follow a straightforward pattern:
a higher amount of solar radiation reaches Earth around the equator,
where temperatures are on average higher than at higher latitudes.
We would expect that higher temperatures in ocean waters would cause
a greater amount of water evaporation, and therefore an increase in ocean salinity.
But when we observe salinity variations, we notice that the higher values
are found around 23° of latitude instead.
This occurs because of the high level of precipitation in equatorial areas, where rain water dilutes the salinity of the ocean.
Areas around the tropics, up to 30° N and S, are extremely dry (that is where most of Earth desert are found).
While the heat is still enough to cause substantial evaporation,
precipitation is extremely scarce or absent.
The consequence is an increase in salinity at these latitudes (known as the tropics).

VARIATION OF OCEAN WATER DENSITY WITH DEPTH
The density of the ocean water is affected mainly by its temperature and its salinity.
Temperature and salinity vary consistently with latitude only at the surface.
At depth they remain essentially constant, and as a consequence the density too does not change much.
In this graph we can see how density of the ocean waters,
when measured at low latitudes (solid red line) increases quickly between ca. 100 m and 1000.
This vertical interval of rapid density increase is defined as the pycnocline.
The pycnocline constitutes an obstacle to water mixing:
the waters above the pycnocline constitute the mixed (or surface) layer.
where mixing with the atmosphere occurs.
Below the mixed layer we distinguish between upper and deep waters:
the Upper water coincides with the pycnocline
and is found above what is called the Deep water, where conditions are more stable
When we look at what happens at high latitudes instead (dashed red line)
we notice that the density of ocean waters remains the same throughout the water column.
At this point minimal variations are sufficient to start downwelling (sinking) of surface waters
that would cause mixing of the waters and oxygenation of the ocean bottom.
Go to part 2 | Go back to the Images Page | Go back to the Home Page
© Alessandro Grippo, 1994-2010
| | | | |